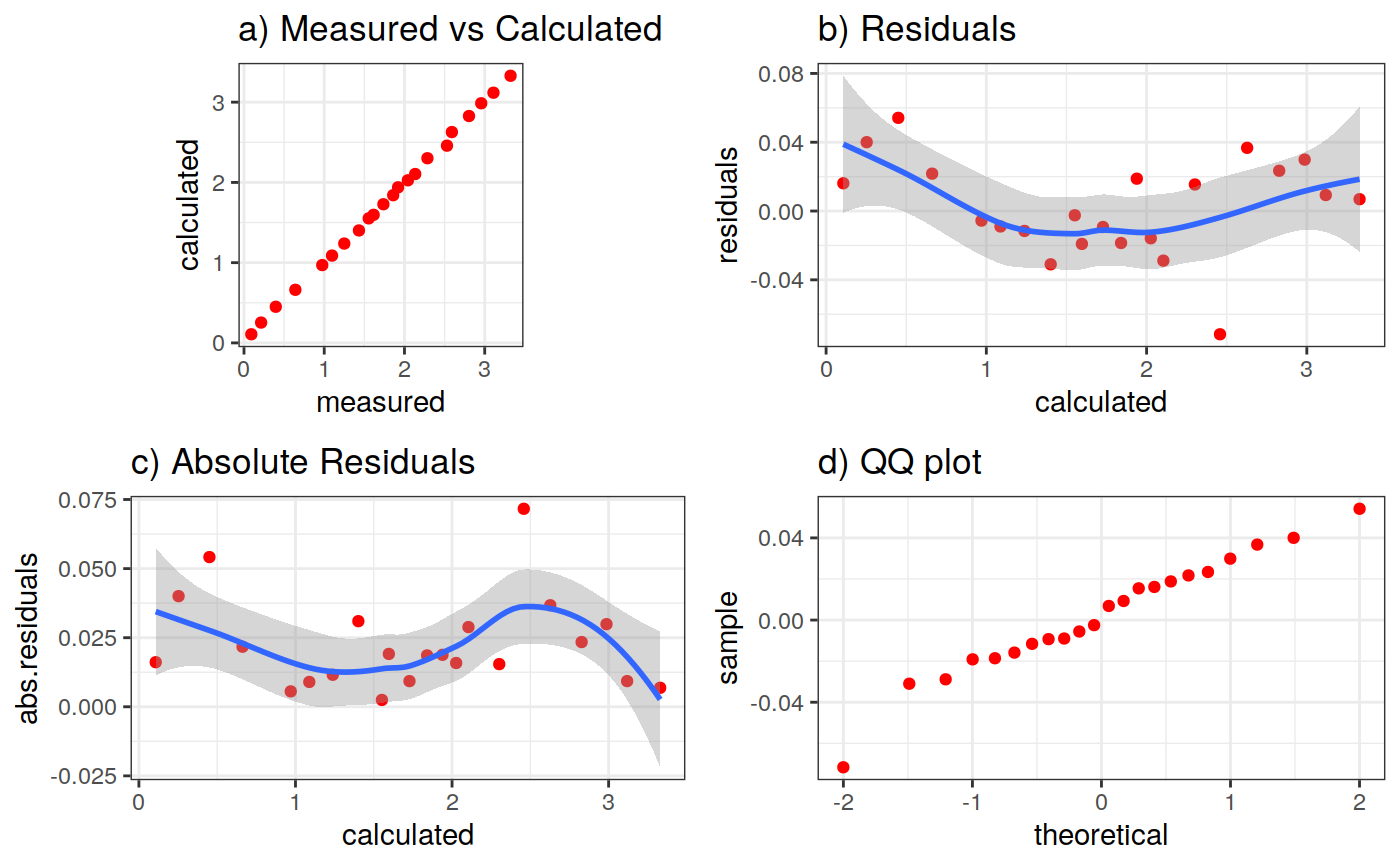
Function to plot the residuals of an estimated pumping test
plot_model_diagnostic(ptest, ...)
Arguments
| ptest | A pumping_test object. It must be estimated. |
|---|---|
| ... | Additional parameters to the plot function used in scatter.smooth |
See also
Other base functions: additional.parameters<-,
confint.pumping_test,
confint_bootstrap,
confint_jackniffe,
confint_wald, estimated<-,
evaluate, fit.optimization,
fit.parameters<-,
fit.sampling, fit,
hydraulic.parameter.names<-,
hydraulic.parameters<-,
model.parameters, model<-,
plot.pumping_test,
plot_sample_influence,
plot_uncert,
print.pumping_test,
pumping_test, simulate,
summary.pumping_test
Examples
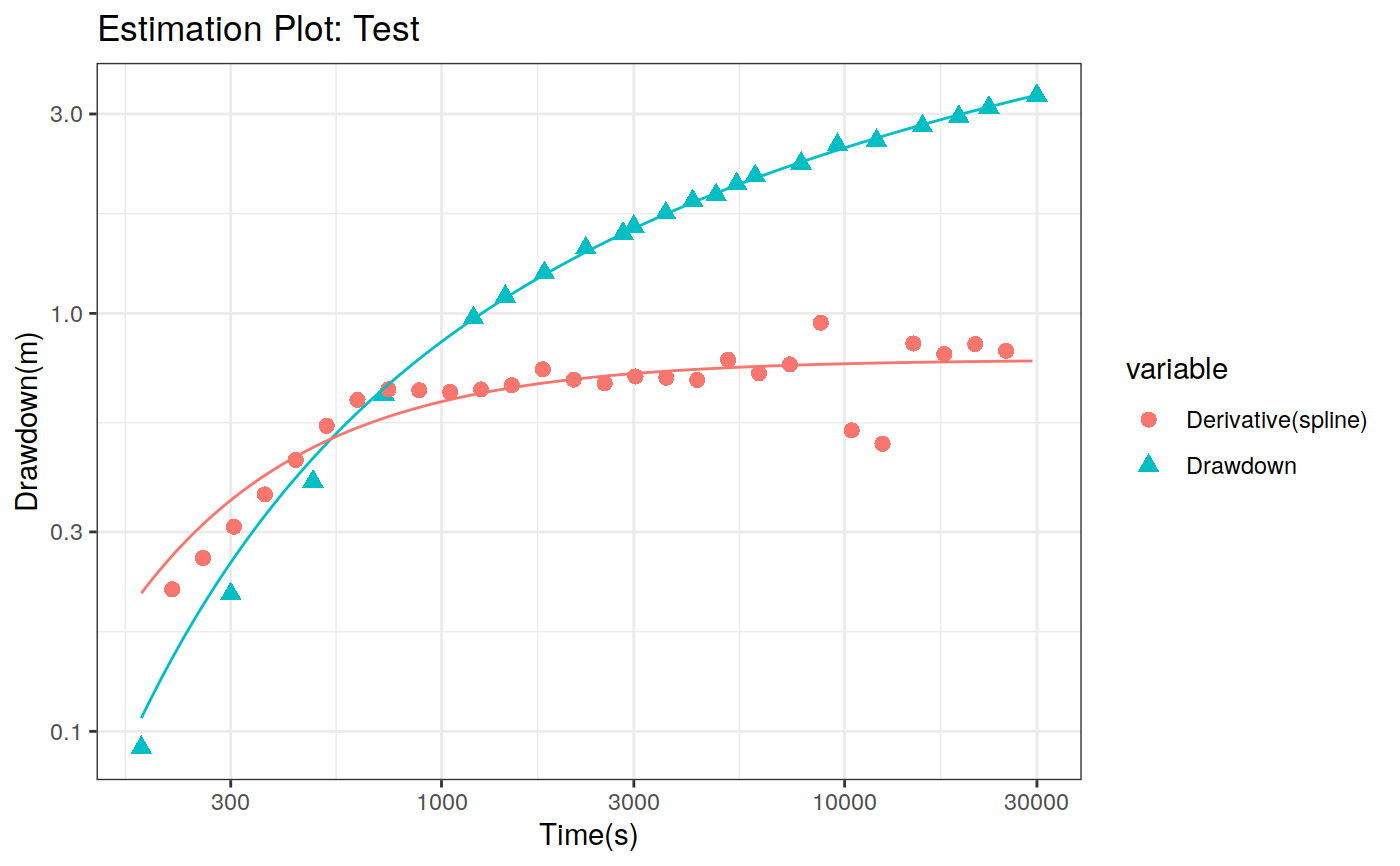
data(theis) ptest <- pumping_test("Test", Q = 1.388e-2, r = 250, t = theis$t, s = theis$s) ptest.fit <- fit(ptest, "theis") hydraulic.parameters(ptest) <- ptest.fit$hydraulic_parameters fit.parameters(ptest) <- ptest.fit$parameters model(ptest) <- "theis" estimated(ptest) <- TRUE plot(ptest, type = 'estimation', dmethod = "spline", d = 30)#>plot_model_diagnostic(ptest)#>#>#> TableGrob (2 x 2) "arrange": 4 grobs #> z cells name grob #> 1 1 (1-1,1-1) arrange gtable[layout] #> 2 2 (1-1,2-2) arrange gtable[layout] #> 3 3 (2-2,1-1) arrange gtable[layout] #> 4 4 (2-2,2-2) arrange gtable[layout]