Function to calculate the derivative of the drawdown with respect to the derivative of log time using the interpolation of the measured points with spline
log_derivative_spline(t, s, n = 20, return.pos = T, log = T)
Arguments
| t | Numeric vector with the time |
|---|---|
| s | Numeric vector with the drawdown |
| n | Number of points where the derivative is calculated |
| return.pos | Logical flag to return only the positive values of the log-derivative (default = TRUE) |
| log | Logical flag to indicate that natural logarithm (a log to the base e) is used in the derivative calculation (default = TRUE). Logarithm to the base 10 is used if FALSE. |
Value
A list with
x: Numeric vector with the x coordinates where the log-derivative is evaluated
y: Numeric vector with the value of the log-derivative
References
Renard, P.; Glenz, D. , Mejias, M. Understanding diagnostic plots for well-test estimation, Hydrogeology Journal, 2008, 17, 589-600
See also
Other log_derivative functions: log_derivative_bourdet,
log_derivative_central,
log_derivative_horner,
log_derivative_kernelreg,
log_derivative_locpol,
log_derivative_lokern,
log_derivative_lpridge,
log_derivative_smoothspline,
log_derivative_spane,
log_derivative
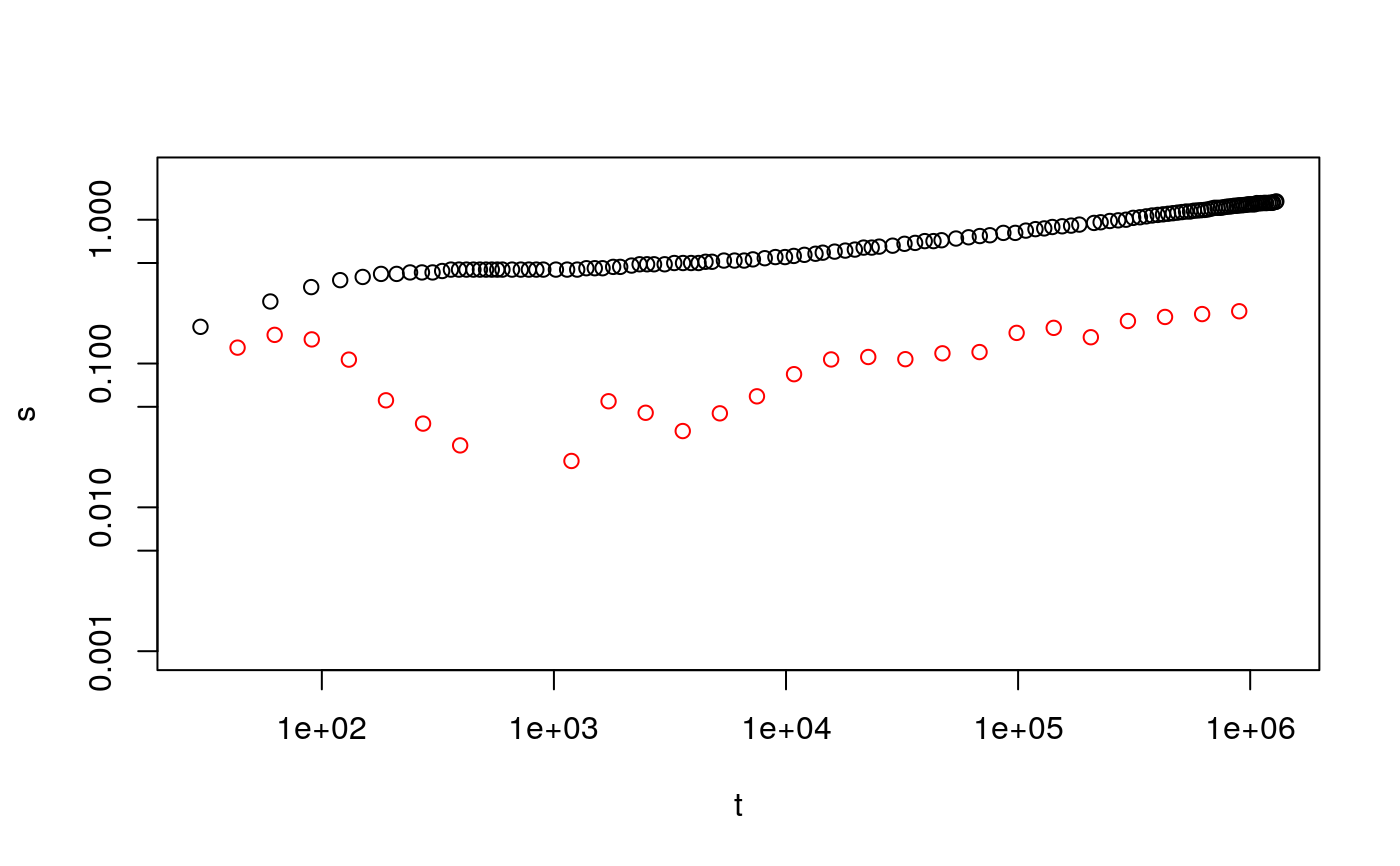
Examples
# Load test data data(boulton) t <- boulton$t s <- boulton$s ptest <- pumping_test('Well1', Q = 0.03, r = 20, t = t, s = s) # dptest.sp <- log_derivative_spline(ptest$t, ptest$s, n = 30) plot(t, s, type="p", log="xy", ylim = c(1e-3,2))