plot_ves
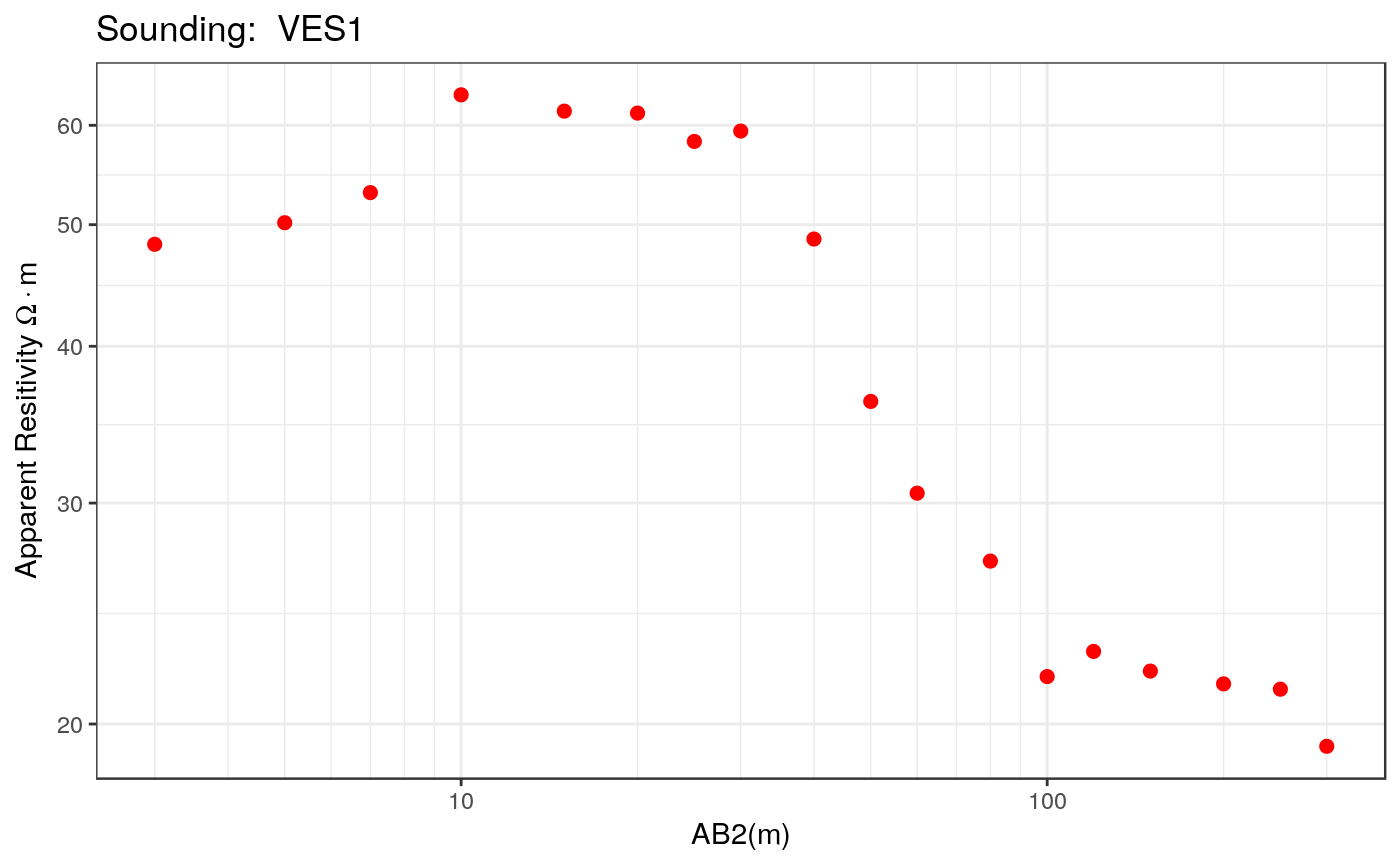
plot_ves.RdFunction to plot the Vertical Electric Sounding data. This function can create two different types of plots: resistivity and interpretation. The resistivity plot includes the apparent resistivity vs electrode spacing. In the interpretation plot, the values of the apparent resistivity vs electrode spacing and the thickness and real resisitivity of the layers are included.
plot_ves(x, main = NULL, ...)
Arguments
| x | A VES object |
|---|---|
| main | Title of the plot |
| ... | Additional parameters to be passed to the plot function |
Examples
data(ves_data1)
ab2 <- ves_data1$ab2
apprho <- ves_data1$apprho
sev1a <- ves(id= "VES1", ab2 = ab2, apprho = apprho)
plot_ves(sev1a)