plot_diagnostic
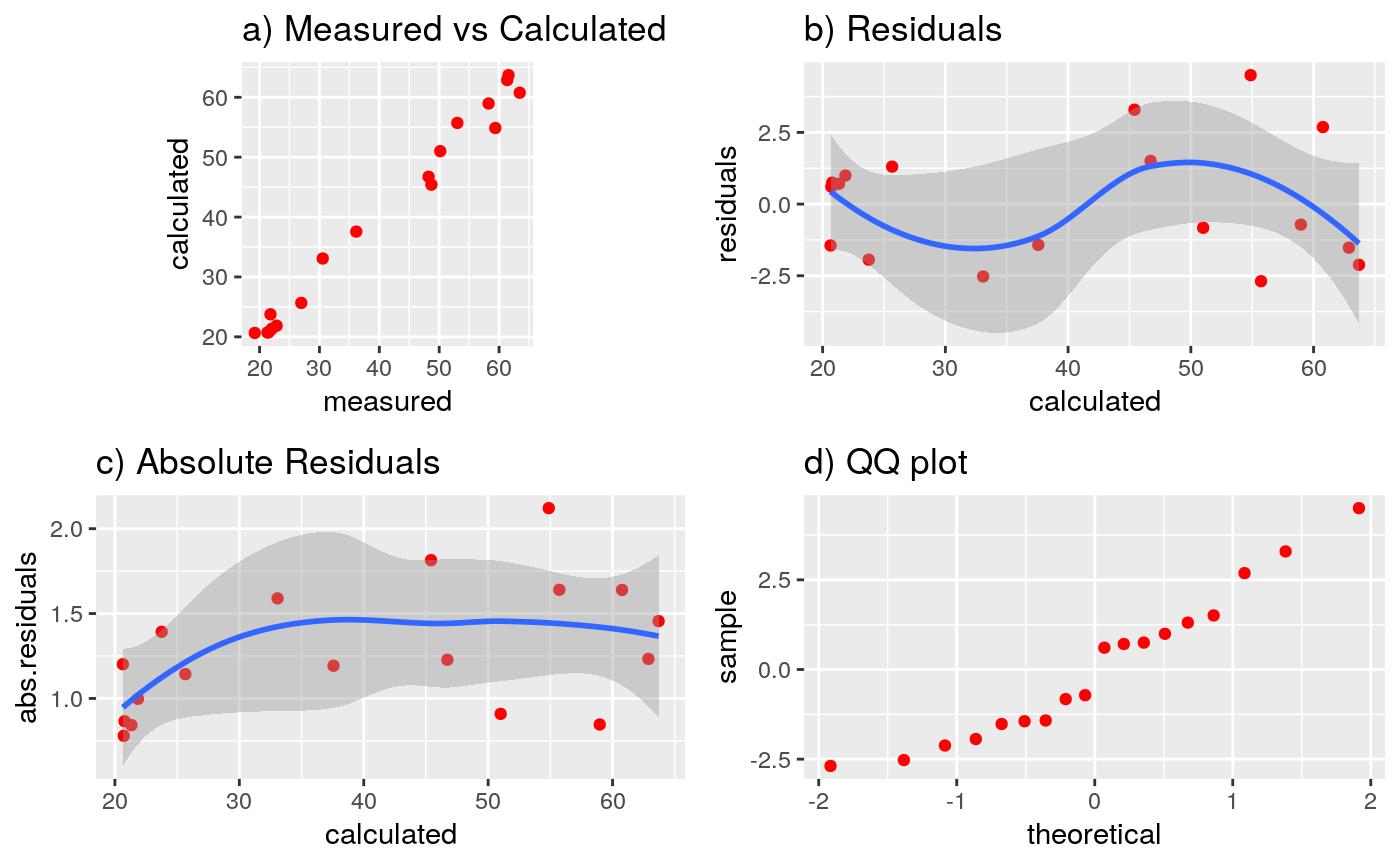
plot_diagnostic.RdFunction to create an estimation diagnostic plot composed of:
Scatterplot between the measured and calculated apparement resistivity
Scatterplot between calculated apparent resistivity and the residuals
Scatterplot between the calculated apparent resistivity and the standarized residuals
QQplot of the residuals
plot_diagnostic(x)
Arguments
| x | A VES object, The VES must be intepreted. |
|---|
Value
This function returns a ggplot2 object
Examples
library(grid) data(ves_data1) ab2 <- ves_data1$ab2 apprho <- ves_data1$apprho sev1a <- ves(id= "VES1", ab2 = ab2, apprho = apprho) rho <- c(40, 70, 30, 20) thick <- c(2, 10, 50, 500) par0 <- c(rho, thick) res.nls1 <- calibrate_nls(sev1a, par0, iterations = 30, ireport = 5, trace = FALSE) sev1a$rhopar <- res.nls1$rho sev1a$thickpar <- res.nls1$thickness sev1a$interpreted <- TRUE p1 <- plot_diagnostic(sev1a)#>#>grid.draw(p1)